
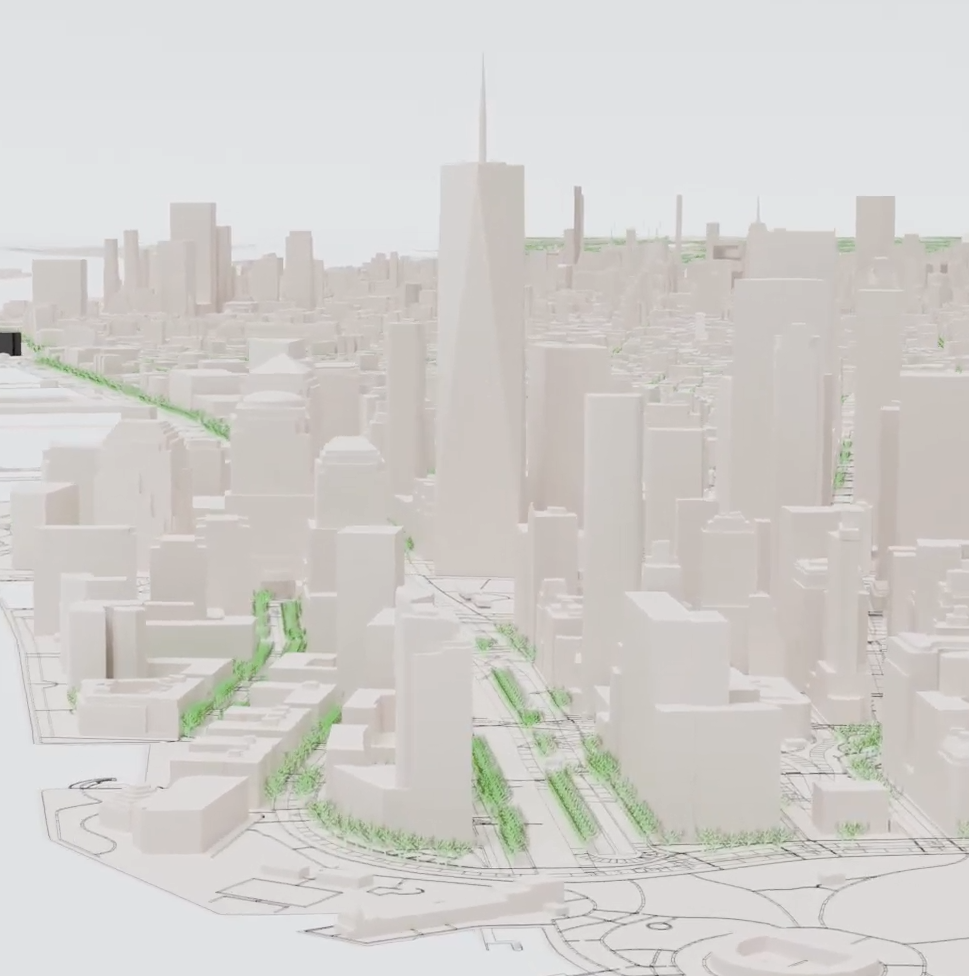
Modeled a 3D environment of New York City's trees to highlight division within the city and the importance of
trees.
Developed a foundational understanding of GIS data, Python in Blender, and working with Princeton's
Adroit-Vis cluster.
Documented all work using GitBook and published movie to YouTube.
Softwares: Blender, Python, Premiere Pro, QGIS, R, GitBook
July 2024
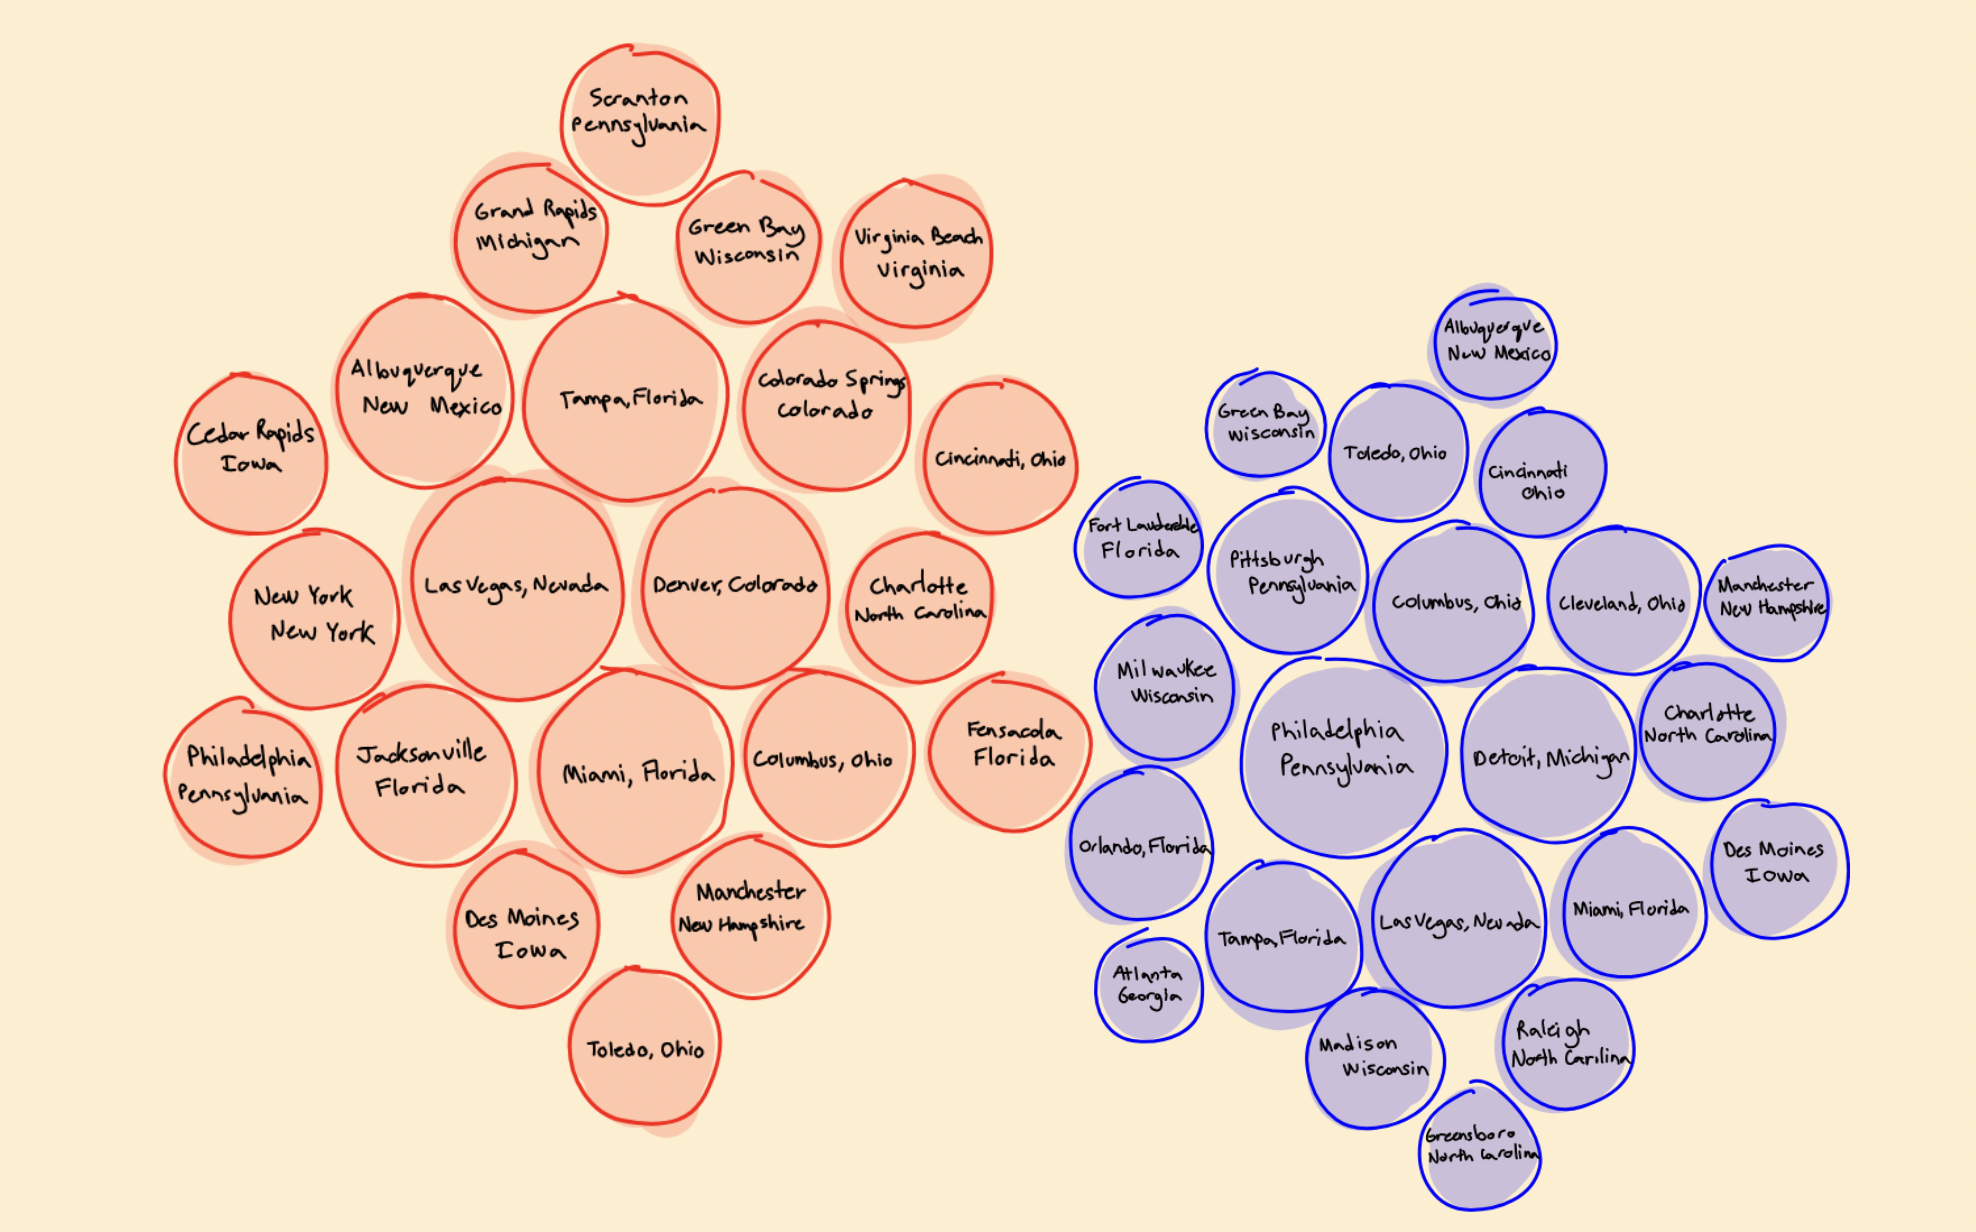
Led a 5-person group to analyze Presidential candidates' campaign visits to find patterns to predict future
elections.
Created 6 interactive maps using R to visualize candidate's travels over time, using gganimate, ggplot2, and
GIS.
Published findings to an online website created using JavaScript that held the front page at
cornelldatajournal.org.
Softwares: JavaScript, HTML, CSS, Excel, R, Python
September - November 2024
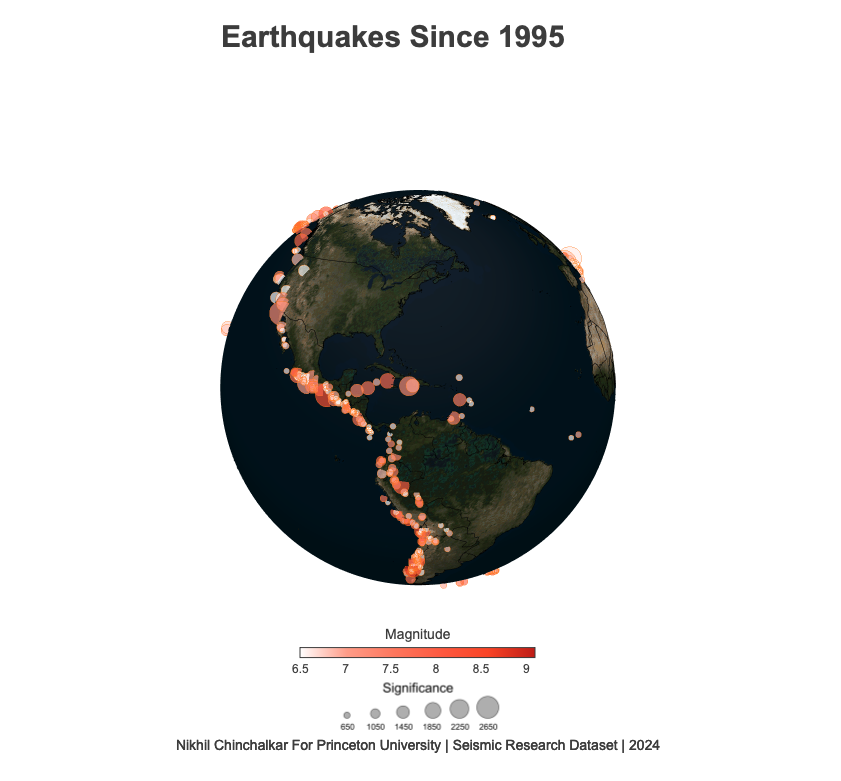
Developed tutorials for 13 different animations, both basic and advanced, all exclusively within R.
Included pushing the limits of packages ggplot2, gganimate, and plotly to generate never-before-seen
visuals.
Documented every line of code using GitBook
and gave a workshop to 12 students and researchers at Princeton University.
Softwares: R, GitBook
June 2024
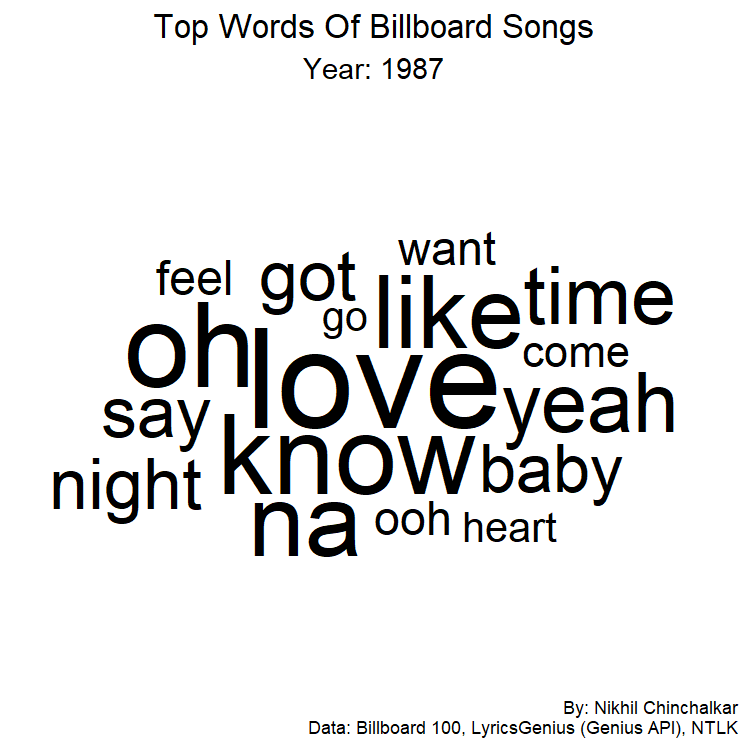
Lead a 7-person project where we made several visualizations detailing how top music (Billboard Top 100)
changed since 1960.
Included using the Genius API (LyricGenius), NLTK, gganimate, and
ggplot2.
Visualizations published to and hosted on billboardsentiments.com
Softwares: R, Python, Premiere Pro, HTML, CSS, JavaScript, Excel
January - May 2024
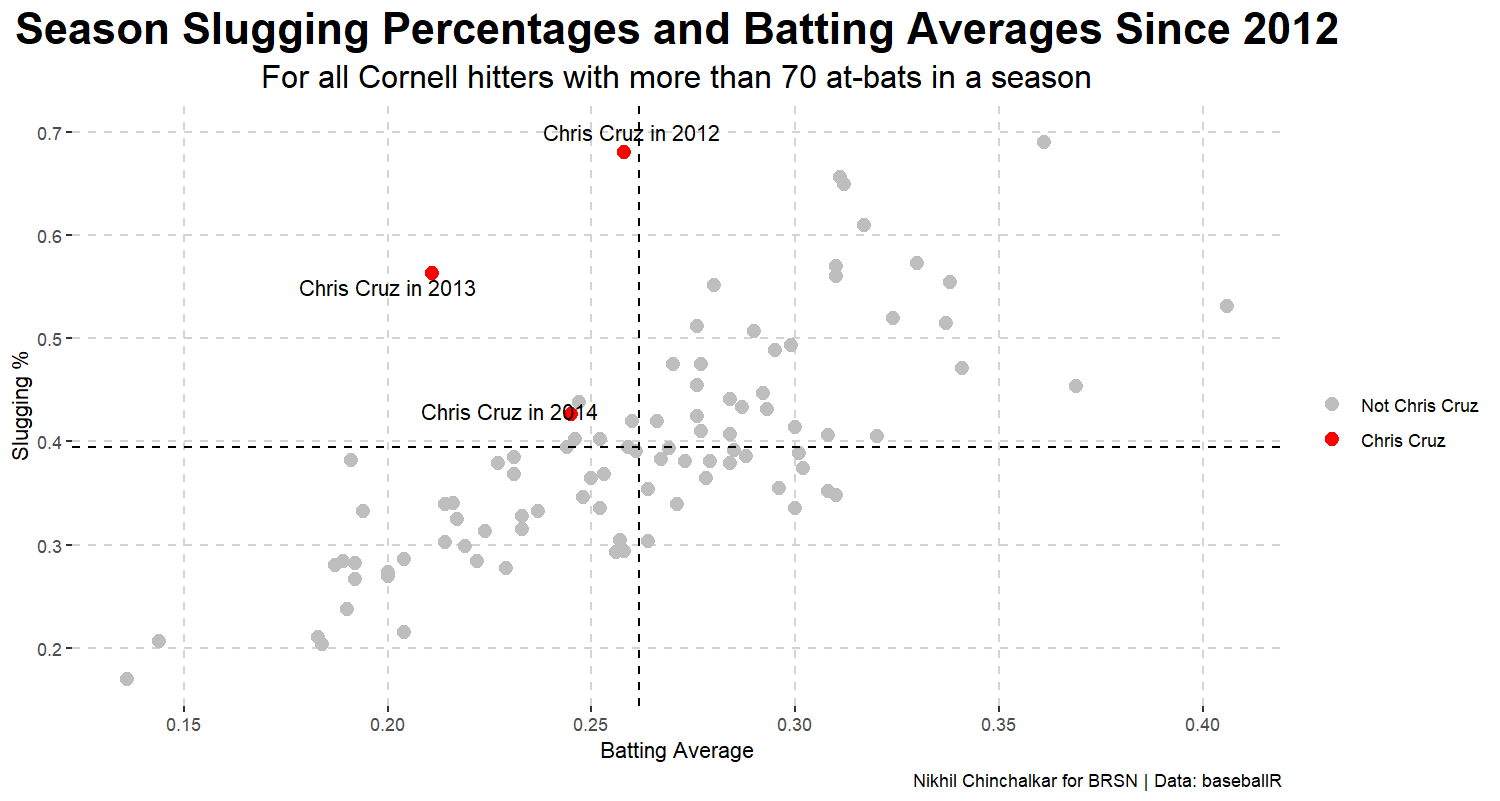
Worked with BaseballR to create an interactive webpage that described the context behind a walk-off homerun
for
Cornell baseball in 2012.
Skill included generating meaningful plots, modeling an environment, and
implementing scroll-based animations.
Published to BRSN's
website.
Softwares: R, Excel, HTML, CSS, Blender, Premiere Pro
April - May 2024